1)
a.Yes, a curve would be acceptable because otherwise it would be unfair to kids that didn't have time to finish.
b.The teacher is at fault, but there are other solutions that can be used instead, such as counting the question as extra credit.
c.Yes a curve would be acceptable, because it would benefit all students in his situation.
d.No, there is no reason to curve the test if all students received what is considered a good grade.
e.Yes, the test should be curved just because some students didn't do as well shouldn't bring the whole group down.
f.The teacher is at fault and the test could either be curved or just not count the questions.
2)The average score is higher which reflects better on the teacher and students. Students might not study, because their grade will be increased either way. Students who did poorly don't know if they need to improved or not based off of their test scores.
3)There is an even distribution from facing grades to 100% grades. No, Considering that means half of the kids failed.
4)
a. Median: 80
Mode:75
Range:31
Standard Deviation:9.9
b. The data is normally distributed because there are more people in the center of the histogram meaning that more people had an average score as opposed to a score on the extreme side of the spectrum.
a. Median: 80
Mode:75
Range:31
Standard Deviation:9.9
b. The data is normally distributed because there are more people in the center of the histogram meaning that more people had an average score as opposed to a score on the extreme side of the spectrum.

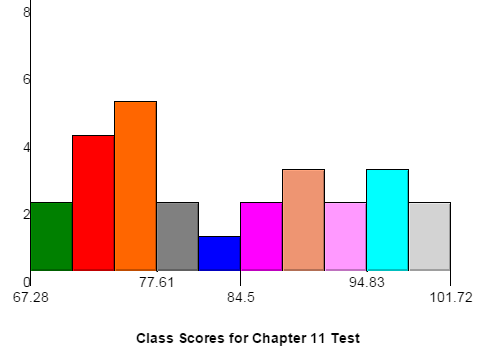
5)
b.Median:83
Mode:77
Range:31
Standard Deviation: 9.9
c.The data is the same as the above chart with the exception that the average is higher.
d. There is a change in the mode, mean, and median and there is no change in the range and standard deviation. The amount of scores recorded are the same the only thing that changes is each number going up by a rate of three.